Salary Prediction Model (Regression)


Salary Prediction Model
Project Overview
This project builds a machine learning model to predict employee salaries from demographic and professional attributes such as age, gender, education, job title, and experience.
It demonstrates an end-to-end regression workflow that includes data cleaning, feature engineering, model training, evaluation, and deployment-ready preprocessing pipelines.
What This Project Shows
Real-world tabular data preprocessing, including missing value handling, duplicate removal, and skewed feature transformation.
Reusable scikit-learn pipelines for numerical and categorical features.
Model comparison between Linear Regression and Ridge Regression with GridSearchCV.
Evaluation using MAE, RMSE, R², and residual analysis.
Dataset and Features
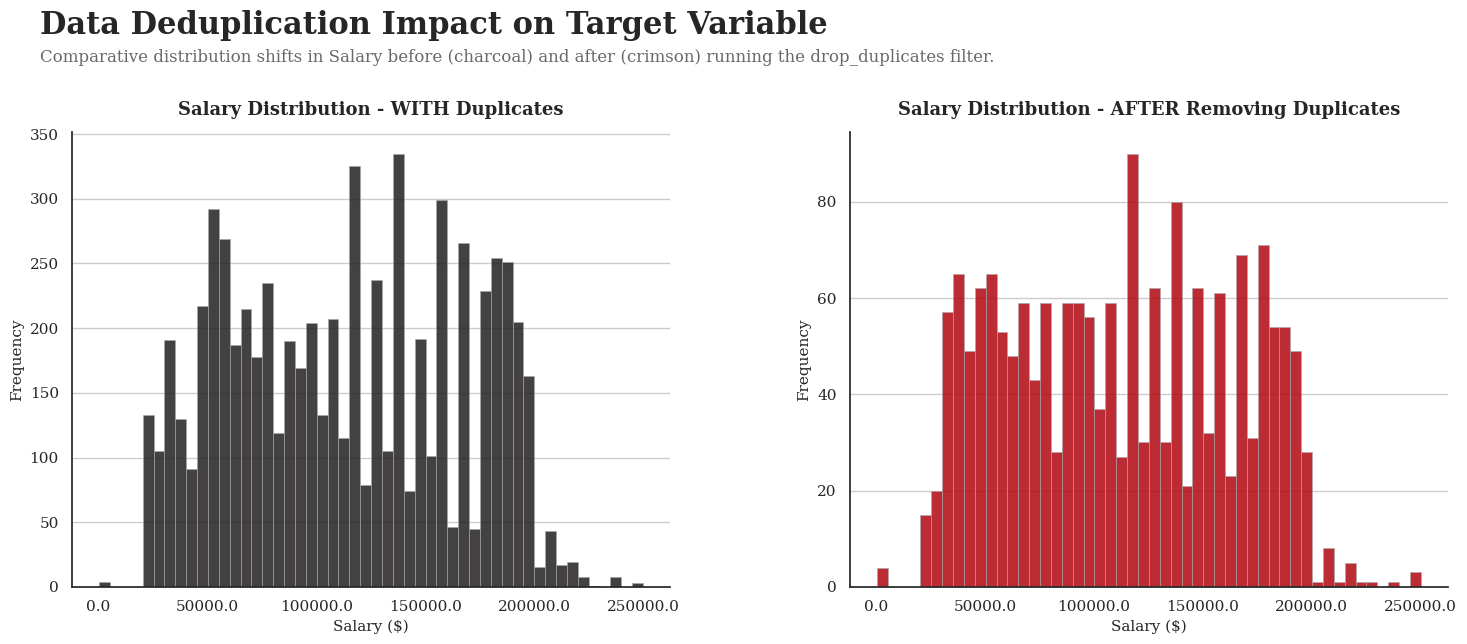
Final dataset size: 1,792 unique records after removing duplicates from the original 6,704 rows.
Target variable: Annual salary in USD.
Main input features: Age, Experience, Gender, Education level, and Job title.
Preprocessing steps:
- Missing values imputed using median for numeric features and most frequent value for categorical features.
- Log1p transformation applied to Salary and Experience to reduce right skew.
- Standard scaling used for numeric features, with one-hot and ordinal encoding for categorical variables.
Models and Performance
Model | MAE | RMSE | MSE | R² |
|---|---|---|---|---|
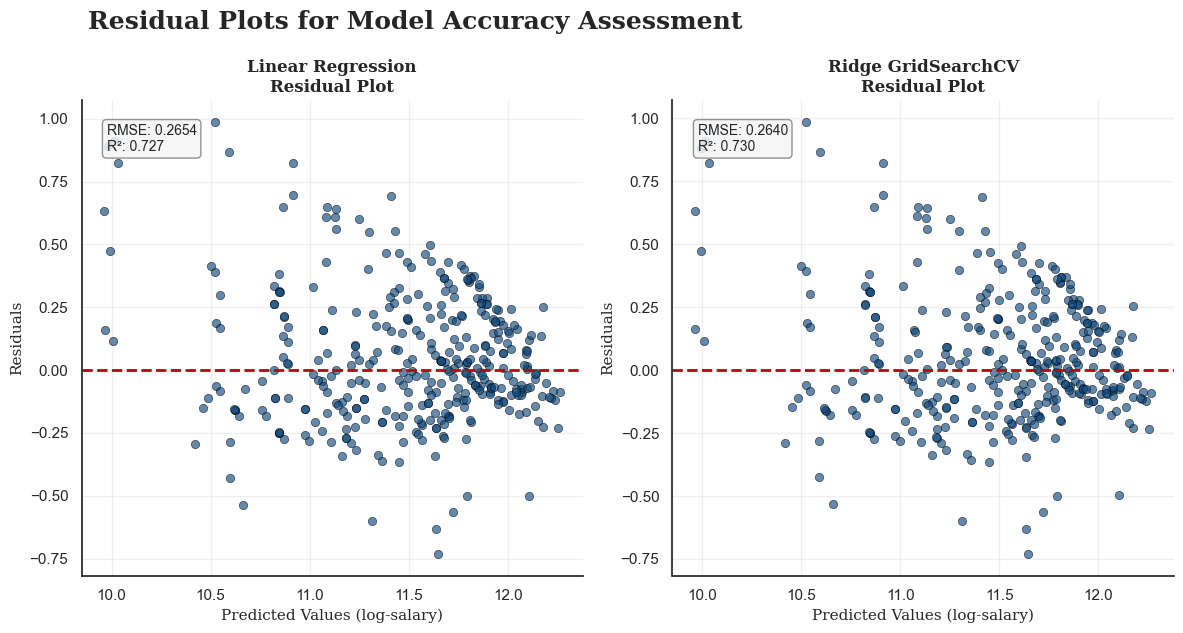
Linear Regression | 0.200 | 0.265 | 0.070 | 0.727 |
Ridge Regression (GridSearchCV) | 0.199 | 0.264 | 0.070 | 0.730 |
Linear Regression is the preferred model because it performs slightly better on the test set and is easier to explain to non-technical stakeholders.
Ridge Regression adds regularization, but it does not produce a meaningful improvement for this dataset.
Analysis Visualizations
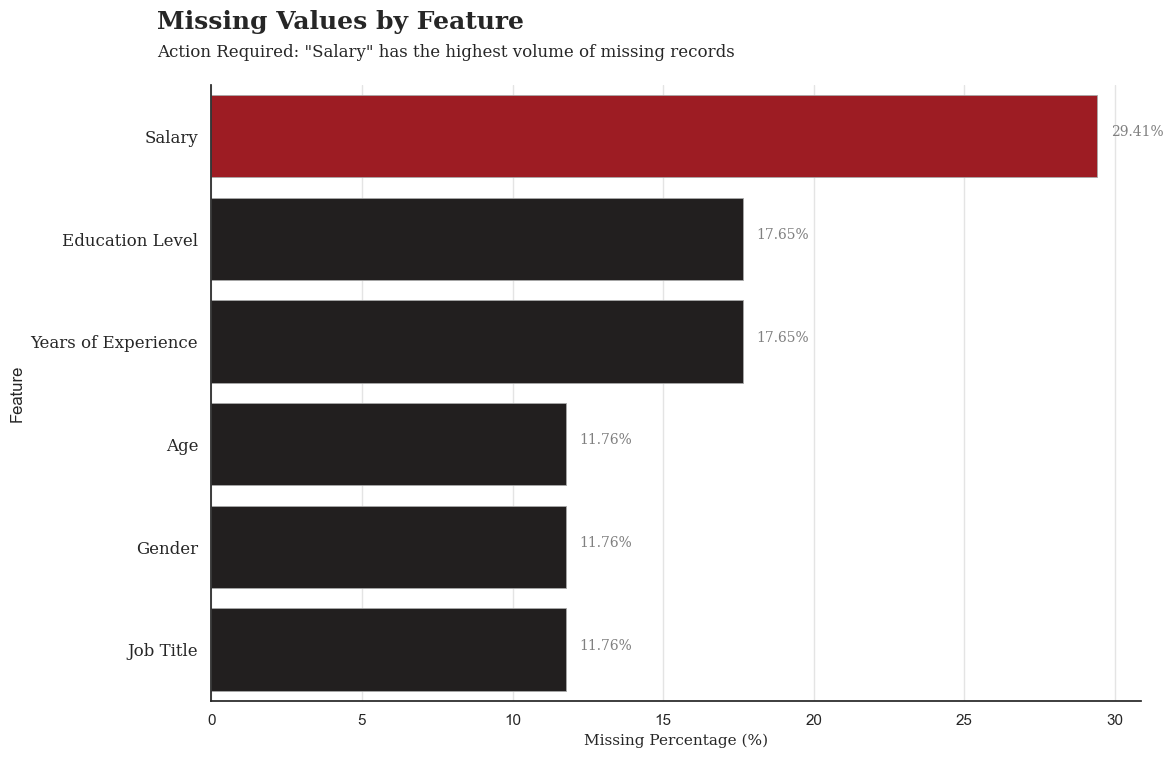
1. Missing Value Bar Chart
This chart highlights the percentage or count of missing values across all features before imputation.
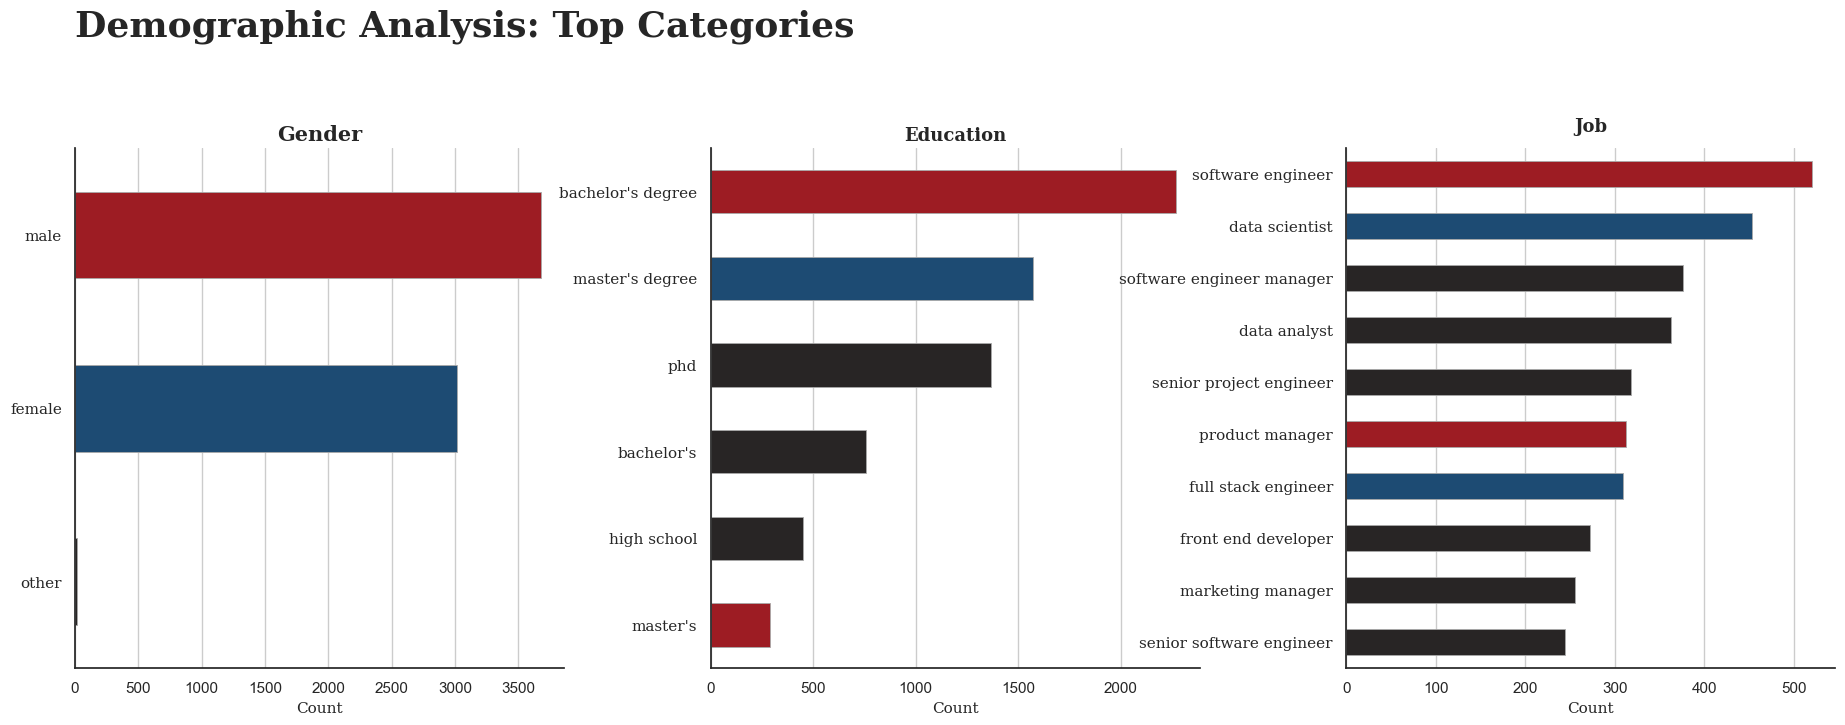
2. Demographic Analysis: Top Categories
This visualization summarizes the most frequent categories across key demographic features such as gender, education, and job title.
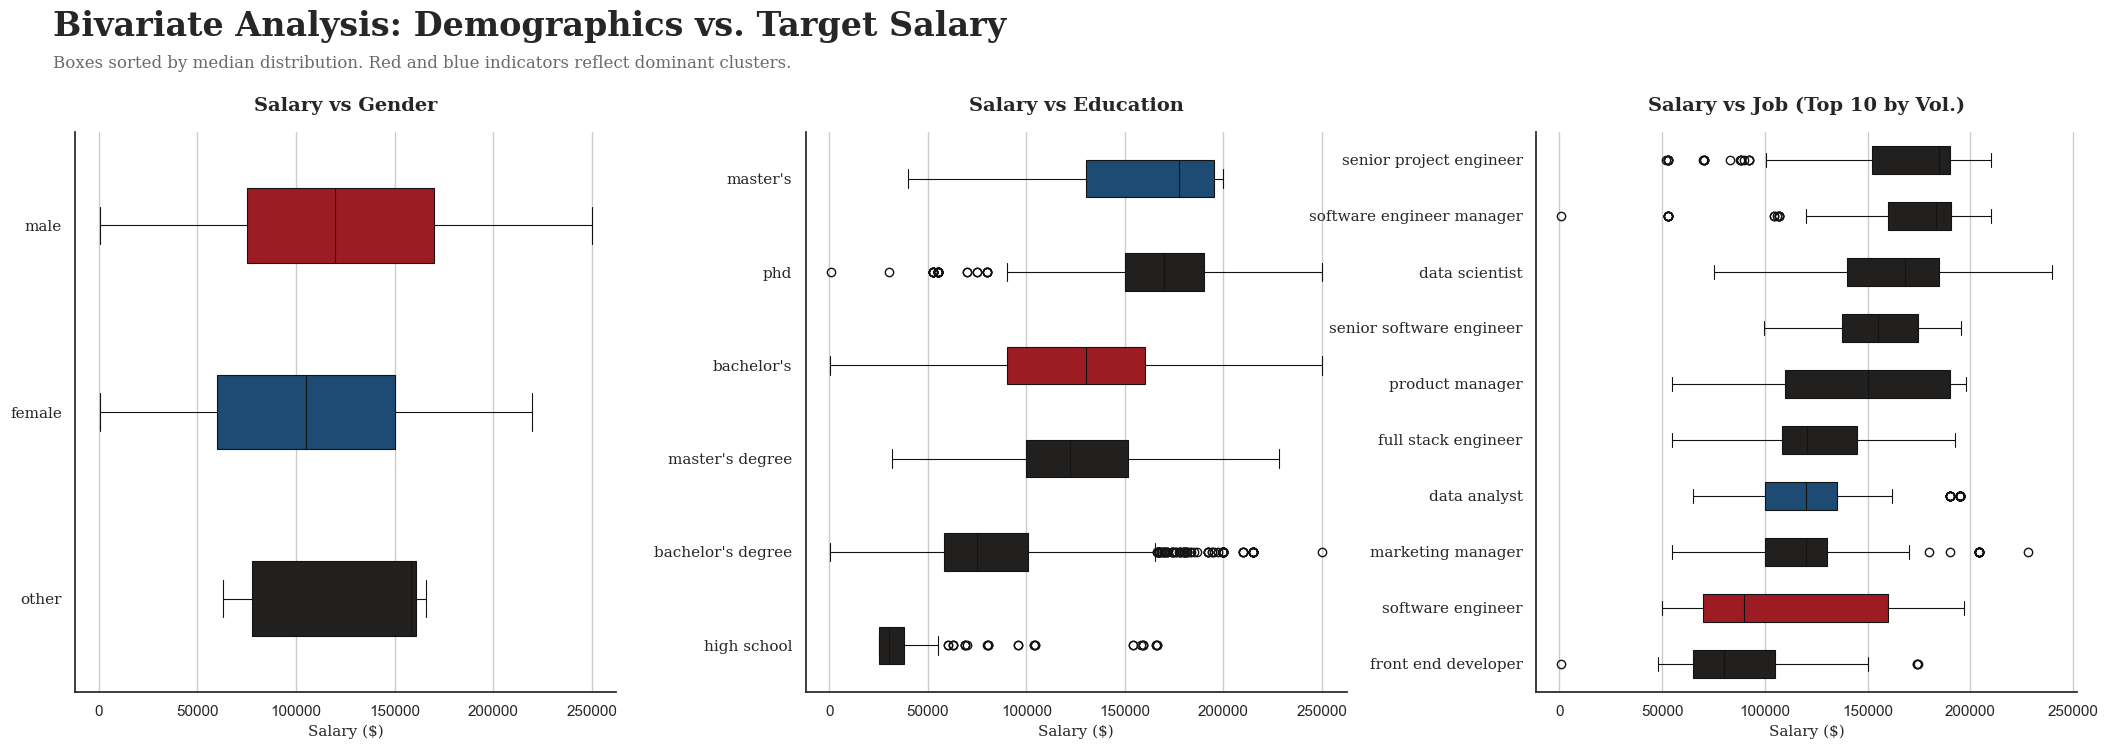
3. Bivariate Analysis: Demographics vs Target Salary
This plot shows how salary varies across demographic categories and helps identify category-level salary trends.
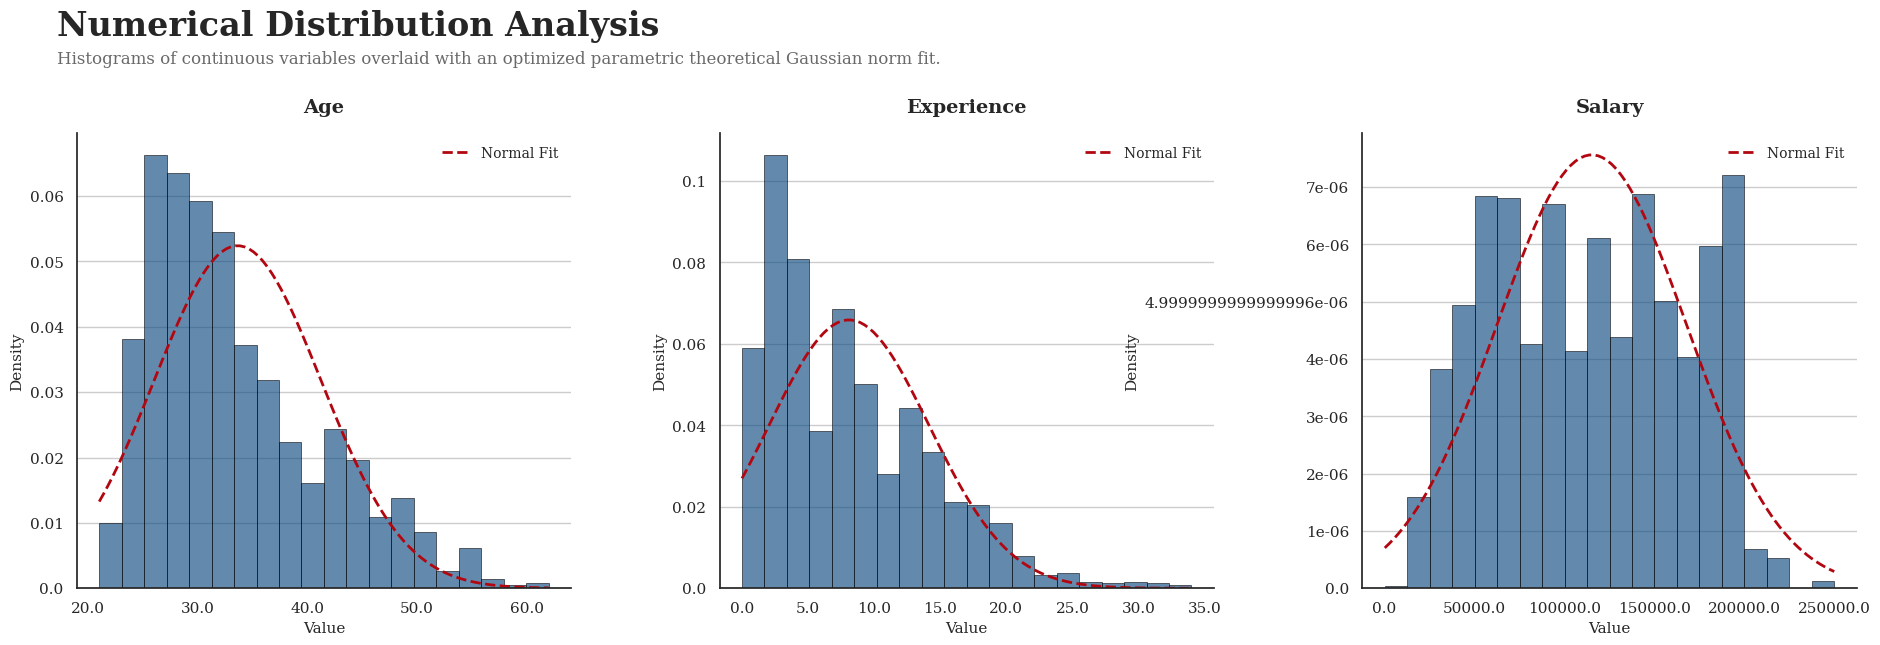
4. Numerical Distribution Analysis
This figure presents the distribution of numerical features such as salary, age, and experience to assess skewness and spread.
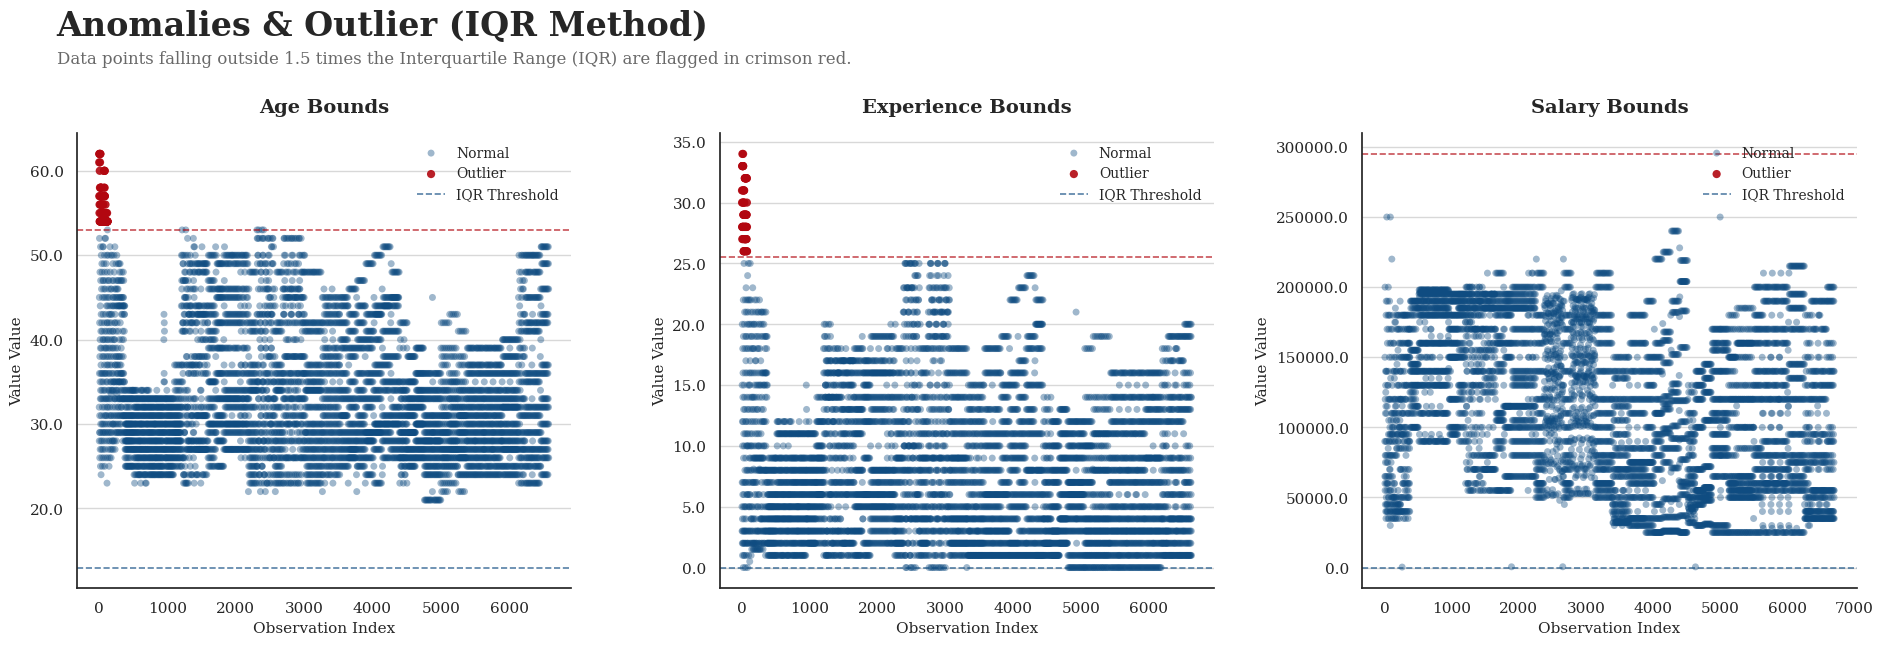
5. Anomalies & Outlier (IQR Method)
This chart identifies outliers in numerical variables using the Interquartile Range method.
6. Data Deduplication Impact on Target Variable
This visualization compares salary distribution before and after duplicate removal to show the effect of data deduplication.
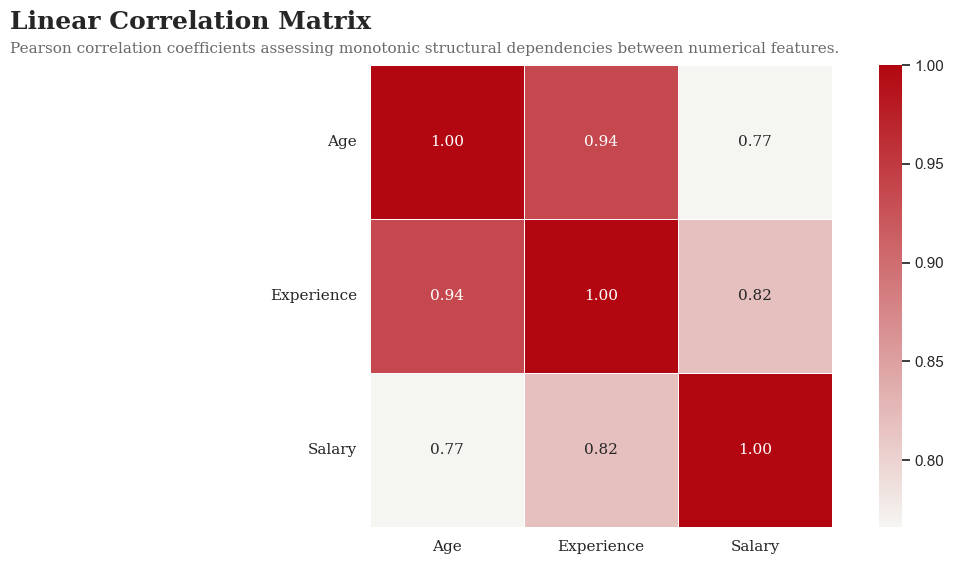
7. Linear Correlation Matrix
This heatmap shows pairwise correlations among numerical features and helps detect multicollinearity.
8. Residual Plots for Model Accuracy Assessment
Residual scatter plots are used to evaluate prediction error patterns and overall model fit.
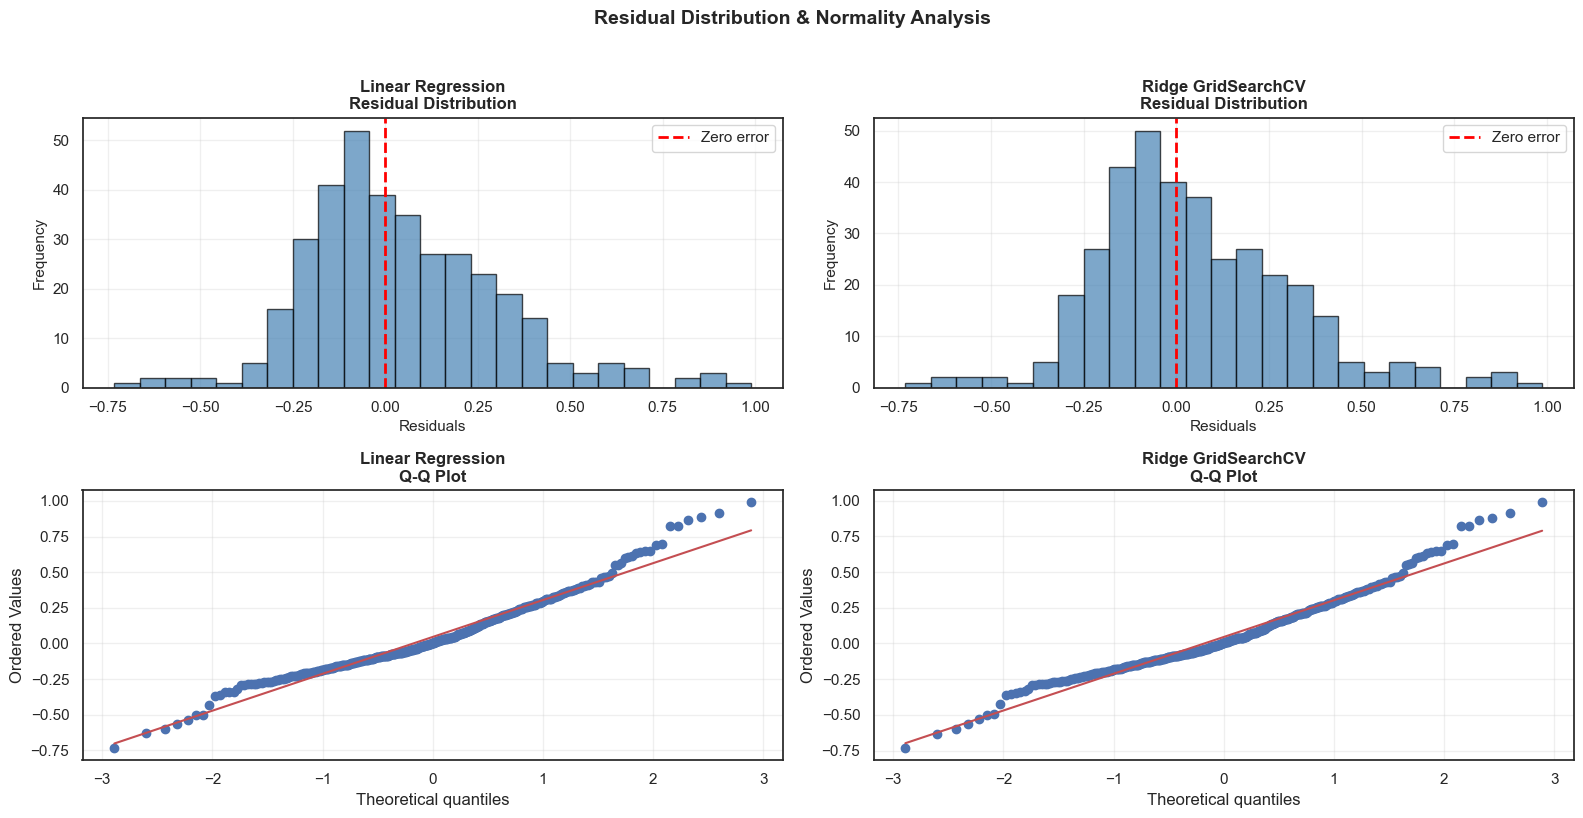
9. Residual Distribution & Normality Analysis
This figure evaluates whether model residuals are approximately normally distributed using histograms and Q-Q plots.
Tech Stack
Python and Jupyter Notebook
pandas and numpy for data handling and feature engineering.
scikit-learn for preprocessing, pipelines, regression models, and GridSearchCV.
matplotlib and seaborn for EDA and diagnostic visualizations.
scipy for statistical testing during residual analysis.
Quick Start
git clone <your-repo-url>cd Salary_Predictionpython -m venv venvWindows
venv\Scripts\activatepip install -r requirements.txtRun the notebook or script to preprocess the data, train the models, evaluate results, and generate salary predictions.